
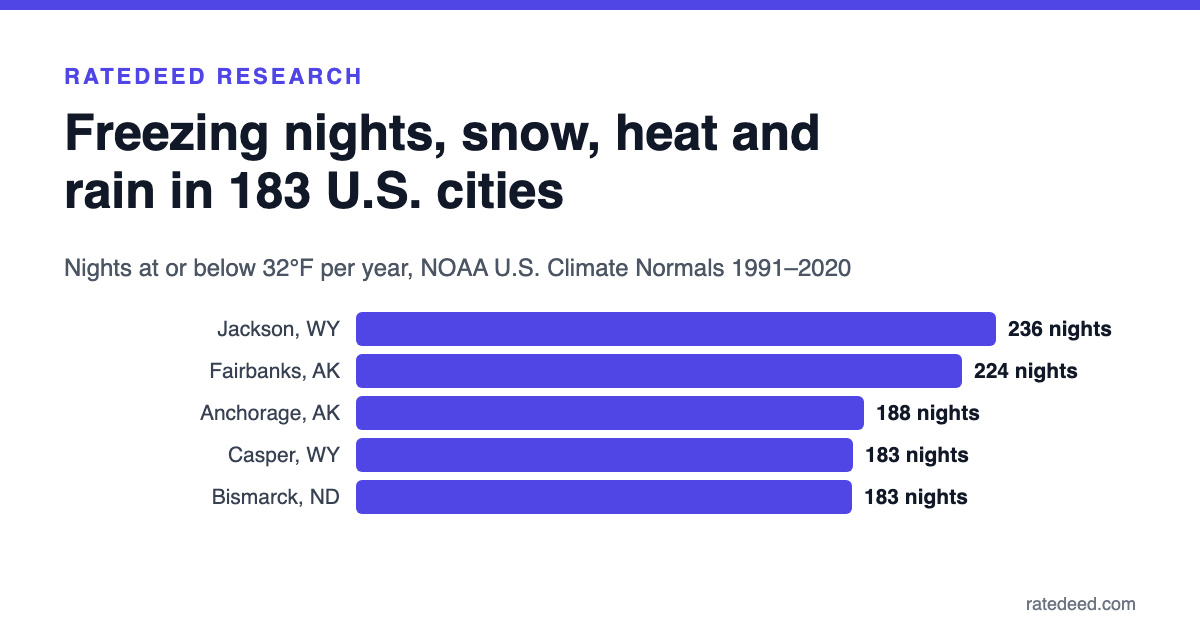
Climate decides which home problems a city sees most: frozen pipes, ice dams, overworked air conditioners or soggy foundations. We matched each of the 183 cities in the RateDeed directory to its nearest weather station with complete NOAA U.S. Climate Normals for 1991–2020.
Key findings
- 147 cities are heating-dominated, 21 cooling-dominated and 15 have real heating and cooling seasons (by degree days).
- Jackson, WY has the most freezing nights: about 236 a year.
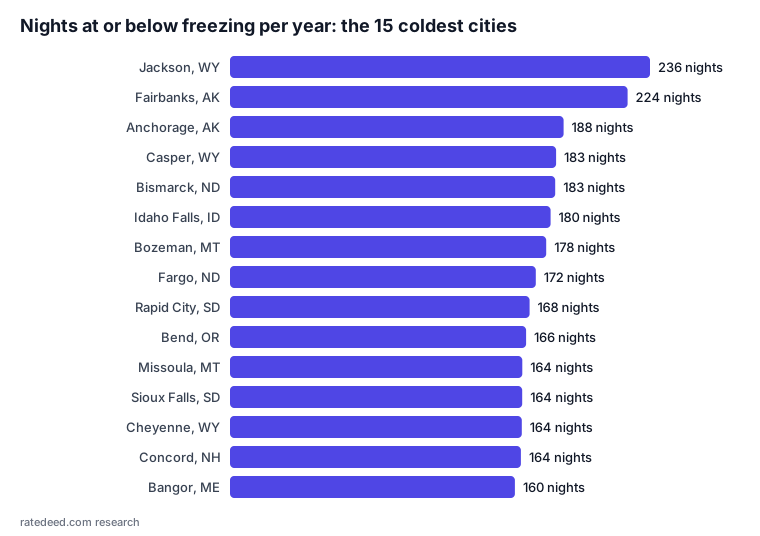
Most nights at or below freezing
Pipes in exterior walls, crawl spaces and attics need insulation; hoses should be disconnected in fall.
| Rank | City | Nights a year |
|---|---|---|
| 1 | Jackson, WY | 236 |
| 2 | Fairbanks, AK | 224 |
| 3 | Anchorage, AK | 188 |
| 4 | Casper, WY | 183 |
| 5 | Bismarck, ND | 183 |
| 6 | Idaho Falls, ID | 180 |
| 7 | Bozeman, MT | 178 |
| 8 | Fargo, ND | 172 |
| 9 | Rapid City, SD | 168 |
| 10 | Bend, OR | 166 |
Snowiest cities
Ice dams are common; ask roofers about ice-and-water shield and attic ventilation.
| Rank | City | Inches of snow a year |
|---|---|---|
| 1 | Buffalo, NY | 95 |
| 2 | Boulder, CO | 88 |
| 3 | Juneau, AK | 87 |
| 4 | Burlington, VT | 81 |
| 5 | South Burlington, VT | 81 |
| 6 | Grand Rapids, MI | 75 |
| 7 | Casper, WY | 75 |
| 8 | Anchorage, AK | 74 |
| 9 | South Bend, IN | 67 |
| 10 | Bangor, ME | 66 |
Most days at 90°F or hotter
Air conditioning dominates energy use; the SEER2 efficiency rating matters most.
| Rank | City | Days a year |
|---|---|---|
| 1 | Phoenix, AZ | 171 |
| 2 | Chandler, AZ | 169 |
| 3 | Mesa, AZ | 169 |
| 4 | Scottsdale, AZ | 157 |
| 5 | Tucson, AZ | 144 |
| 6 | Henderson, NV | 131 |
| 7 | Las Vegas, NV | 127 |
| 8 | Austin, TX | 111 |
| 9 | San Antonio, TX | 111 |
| 10 | Dallas, TX | 97 |
Wettest cities
Flashing, gutters and grading carry more water; drainage deserves attention.
| Rank | City | Inches of precipitation a year |
|---|---|---|
| 1 | Hilo, HI | 127 |
| 2 | Mobile, AL | 66 |
| 3 | Gulfport, MS | 65 |
| 4 | Juneau, AK | 62 |
| 5 | New Orleans, LA | 62 |
| 6 | Miami, FL | 62 |
| 7 | Baton Rouge, LA | 61 |
| 8 | Lafayette, LA | 60 |
| 9 | Houston, TX | 55 |
| 10 | Huntsville, AL | 54 |
Driest cities
Drought-tolerant plants and drip irrigation make the biggest difference to water use.
| Rank | City | Inches of precipitation a year |
|---|---|---|
| 1 | Henderson, NV | 4 |
| 2 | Las Vegas, NV | 5 |
| 3 | Reno, NV | 7 |
| 4 | Chandler, AZ | 8 |
| 5 | Mesa, AZ | 8 |
| 6 | Phoenix, AZ | 8 |
| 7 | Albuquerque, NM | 9 |
| 8 | Las Cruces, NM | 10 |
| 9 | Scottsdale, AZ | 10 |
| 10 | San Diego, CA | 10 |
Methodology
Source: NOAA National Centers for Environmental Information, U.S. Climate Normals 1991–2020 (annual and seasonal normals), retrieved through the NCEI Access Data Service. Each city uses the nearest station with complete normals within 60 km of its center (Anchorage, Fairbanks, Honolulu and Kahului use their main airport stations). Freezing nights are days with a minimum temperature at or below 32°F. Heating- or cooling-dominated means one kind of degree day exceeds the other by more than 50%. Each city links to its RateDeed page.
Download the data
Download the full dataset as a CSV file (183 rows, one per city). It is free to reuse under the Creative Commons Attribution 4.0 license: credit RateDeed and link to this page.