
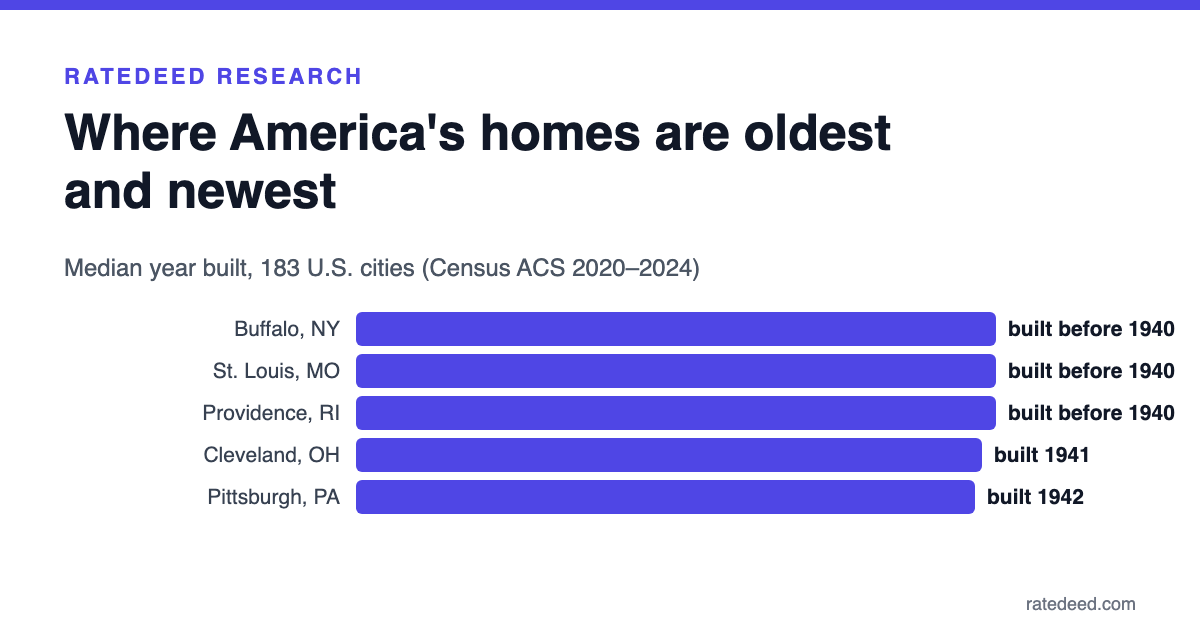
The age of a city's homes decides a lot about the repairs its homeowners face: lead paint rules, old pipes, outdated wiring and roofs on their second or third replacement. We ranked the 183 cities in the RateDeed directory by the age of their housing, using the U.S. Census Bureau, American Community Survey 2020–2024 5-year estimates.
Key findings
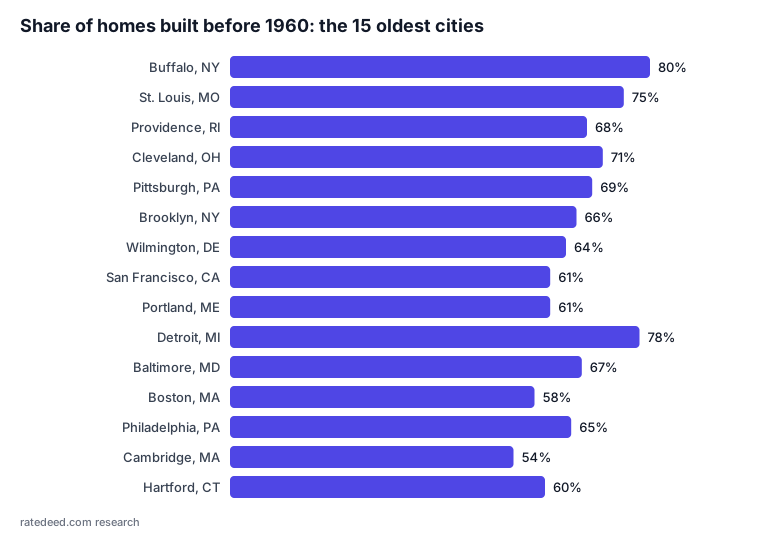
- Buffalo, St. Louis and Providence share the oldest housing of the 183 cities: in each, the typical (median) home was built in 1939 or earlier, the Census Bureau's earliest category. Homes built before 1960 make up 80% in Buffalo, 75% in St. Louis, 68% in Providence.
- Meridian, ID has the newest: median year built 2007, with 40% of homes built in 2010 or later.
- In 112 of the 183 cities, at least half of all homes were built before 1980.
- Nationally, the typical home was built in 1980, and 50% of homes predate 1980.
The 20 cities with the oldest homes
| Rank | City | Median year built | Built before 1960 | Built before 1980 | Median home value |
|---|---|---|---|---|---|
| 1 | Buffalo, NY | 1939 or earlier | 80% | 90% | $164,200 |
| 2 | St. Louis, MO | 1939 or earlier | 75% | 86% | $197,500 |
| 3 | Providence, RI | 1939 or earlier | 68% | 82% | $362,200 |
| 4 | Cleveland, OH | 1941 | 71% | 85% | $102,000 |
| 5 | Pittsburgh, PA | 1942 | 69% | 83% | $205,800 |
| 6 | Brooklyn, NY | 1944 | 66% | 80% | $905,000 |
| 7 | Wilmington, DE | 1946 | 64% | 79% | $231,400 |
| 8 | San Francisco, CA | 1946 | 61% | 76% | $1,394,500 |
| 9 | Portland, ME | 1946 | 61% | 76% | $489,600 |
| 10 | Detroit, MI | 1947 | 78% | 90% | $83,900 |
| 11 | Baltimore, MD | 1947 | 67% | 82% | $229,600 |
| 12 | Boston, MA | 1947 | 58% | 72% | $731,700 |
| 13 | Philadelphia, PA | 1949 | 65% | 83% | $243,100 |
| 14 | Cambridge, MA | 1950 | 54% | 68% | $1,092,100 |
| 15 | Hartford, CT | 1951 | 60% | 80% | $228,600 |
| 16 | Worcester, MA | 1951 | 59% | 75% | $374,400 |
| 17 | Cincinnati, OH | 1951 | 59% | 80% | $230,900 |
| 18 | Manhattan, NY | 1951 | 58% | 78% | $1,090,500 |
| 19 | Minneapolis, MN | 1951 | 57% | 72% | $362,200 |
| 20 | Springfield, MA | 1952 | 64% | 83% | $245,000 |
The 20 cities with the newest homes
| Rank | City | Median year built | Built 2010 or later | Built before 1980 | Median home value |
|---|---|---|---|---|---|
| 1 | Meridian, ID | 2007 | 40% | 7% | $531,600 |
| 2 | Henderson, NV | 2001 | 22% | 7% | $484,900 |
| 3 | Bend, OR | 2001 | 25% | 21% | $718,400 |
| 4 | Nampa, ID | 2000 | 22% | 26% | $370,800 |
| 5 | Bozeman, MT | 2000 | 30% | 32% | $687,900 |
| 6 | Carmel, IN | 1998 | 23% | 22% | $486,800 |
| 7 | Southaven, MS | 1998 | 22% | 23% | $236,300 |
| 8 | Chandler, AZ | 1997 | 17% | 10% | $507,800 |
| 9 | Raleigh, NC | 1997 | 21% | 23% | $415,800 |
| 10 | Fayetteville, AR | 1997 | 22% | 25% | $349,600 |
| 11 | Alpharetta, GA | 1996 | 16% | 8% | $649,000 |
| 12 | West Jordan, UT | 1995 | 16% | 19% | $492,500 |
| 13 | Charlotte, NC | 1995 | 21% | 28% | $385,700 |
| 14 | Durham, NC | 1995 | 25% | 30% | $392,800 |
| 15 | Charleston, SC | 1995 | 26% | 34% | $509,700 |
| 16 | Las Vegas, NV | 1994 | 12% | 23% | $427,900 |
| 17 | Olathe, KS | 1994 | 15% | 24% | $364,700 |
| 18 | Austin, TX | 1994 | 26% | 28% | $555,300 |
| 19 | Columbia, MO | 1993 | 19% | 32% | $284,600 |
| 20 | Sioux Falls, SD | 1993 | 23% | 35% | $292,400 |
What older housing means for repairs
- Lead paint. Any home built before 1978 may contain lead-based paint. Under the EPA's Renovation, Repair and Painting (RRP) rule, contractors who disturb painted surfaces in those homes must be lead-safe certified by the EPA or an authorized state program.
- Pipes. Homes from the mid-20th century were commonly plumbed with galvanized steel supply pipes and cast-iron drains, which corrode with age.
- Wiring. Homes built before the 1960s may have knob-and-tube or ungrounded two-prong wiring and small service panels.
- Roofs. Asphalt-shingle roofs typically last about 20–30 years, so older homes are usually on their second roof or later.
All 183 cities
Methodology
Figures come from the U.S. Census Bureau, American Community Survey 2020–2024 5-year estimates (tables B25035, B25034 and B25077), retrieved through the Census Reporter API on 2026-11-05. Cities are the 183 hub cities in the RateDeed directory. New York City's boroughs use their county figures; Georgetown and Capitol Hill use Washington, DC city-wide figures. Each city links to its RateDeed page, which lists local contractors with the same housing data. A median of "1939 or earlier" means the median falls in the Census Bureau's earliest year-built category, so the true figure may be earlier.
Download the data
Download the full dataset as a CSV file (183 rows, one per city). It is free to reuse under the Creative Commons Attribution 4.0 license: credit RateDeed and link to this page.